
What Is TAM SAM SOM?
Your deck says “big market,” and then someone asks for numbers, and everything gets awkward fast.
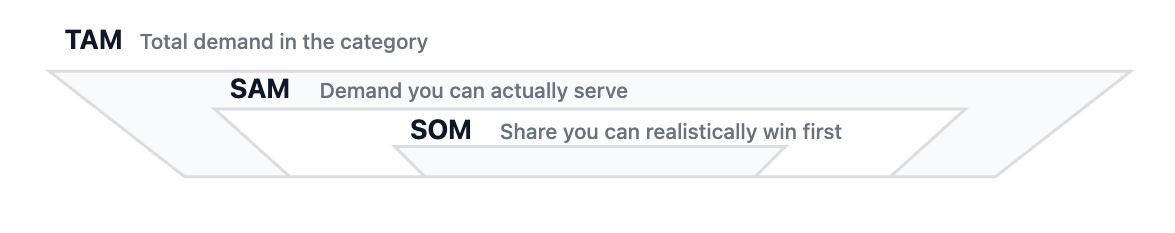
TAM, SAM, and SOM are three market-sizing numbers: TAM is total demand, SAM is the demand you can serve with your model, and SOM is the part you can realistically win first. I use them to make my plan concrete and defendable, not dreamy.
I treat this as a clarity tool. I do not use it to impress people. I use it to pick a target, set goals, and avoid building for a market I cannot reach.
What Is TAM?
TAM (Total Addressable Market) is the total demand for a product category if I could serve everyone, everywhere, with no constraints. It is the “ceiling” number. It helps me show the full potential, but it does not tell me what I can capture next quarter or even next year. That is why TAM is often misunderstood. A big TAM can still be a bad business if I cannot reach the buyers, if competition is brutal, or if the spending power is weaker than it looks.
When I calculate TAM, I try to stay honest about what it represents. TAM is not “people who might like this.” TAM is “people who actually have a reason to spend money for this kind of solution.” I also prefer using one clear method instead of mixing random numbers.
Here are the three TAM methods I use:
(1) Top-Down: start from a published market number, then narrow later
(2) Bottom-Up: price × realistic customer count (my favorite for credibility)
(3) Value-Theory: value created × share of value I could capture (harder, but useful)
If I cannot explain the method in one minute, the TAM is not helping me.
What Is SAM?
SAM (Serviceable Available Market) is the portion of TAM I can actually serve based on my product, geography, channel, and business model. SAM is where market sizing becomes practical. If TAM is “everyone,” SAM is “the customers I can reach and support given how I operate.”
I define SAM by constraints, not by hope. For example, my product might only work for mid-size companies, or only for English-speaking markets, or only for e-commerce brands on Shopify, or only for buyers who need the outcome weekly. Those constraints are not weaknesses. They are clarity.
I like to write SAM as a simple filter:
(1) Who I can serve: segment, industry, role, use case
(2) Where I can serve: geography, language, regulation, logistics
(3) How I serve: sales model (self-serve vs sales-led), onboarding, support capacity
(4) What I sell: the specific category I truly fit today
If I skip this step, my plan becomes unrealistic. I might set growth goals based on people I cannot actually acquire or retain. SAM forces me to respect reality.
What Is SOM?
SOM (Serviceable Obtainable Market) is the portion of SAM I can realistically win in a specific time window, given competition and my execution capacity. SOM is the number I take most seriously, because it connects directly to targets, budgets, and milestones.
SOM is not a guess pulled from the air. I build it using “proof logic.” I start with my channel capacity and conversion assumptions, then I pressure-test them. If I can only do 30 sales calls a week, my SOM cannot assume 10,000 customers next year. If my funnel converts at 2%, I cannot pretend it converts at 20% unless I have evidence.
Here is how I usually estimate SOM in a clean sequence:
(1) pick a reachable segment inside SAM
(2) pick a time window (12 months is common)
(3) estimate reachable leads per month (channel capacity)
(4) apply realistic conversion rates (based on tests or benchmarks)
(5) multiply by price and retention assumptions
(6) compare the result to competitive intensity (can I truly win that share?)
SOM keeps me honest. It forces my plan to match my real ability to reach buyers and deliver value.
What Is The Difference Between TAM SAM SOM?
TAM is the total market, SAM is the market I can serve, and SOM is the share I can win first. I keep it simple with a ladder:
(1) TAM = the whole category
(2) SAM = the part I can actually sell to
(3) SOM = the part I can realistically capture soon
If I want a quick mental image, I think “wide → narrower → actionable.”
This framing also helps me explain my strategy without sounding like I am inflating numbers. I can say: “Here is the full space, here is the part we can truly serve, and here is the beachhead we can win.”
How Do I Calculate TAM SAM SOM Without Making It Fluffy?
I calculate TAM, SAM, and SOM by using simple math, clear assumptions, and proof-friendly inputs. I try to make every number traceable. That means I prefer bottom-up logic whenever possible.
Here is the structured template I use:
(1) Define The Customer Unit: “one customer” means what (one company, one seat, one household)
(2) Define The Price Unit: monthly, annual, per transaction, per seat
(3) Count The Universe: how many units exist (customers in scope)
(4) Apply Filters: narrow to SAM using real constraints
(5) Apply Capacity: narrow to SOM using channel + conversion + time
(6) State Assumptions: list them clearly so readers can challenge them
I also watch for two common mistakes:
(1) Confusing audience size with spending power (big audience, tiny budget)
(2) Choosing SOM as “1% of TAM” with no path to get it (that reads like fantasy)
If I show my assumptions, even imperfect numbers feel credible because the logic is visible.
Conclusion
TAM shows the ceiling, SAM shows the reachable market, and SOM shows what I can actually win first.